EKMA is just that - an approach or set of procedures that allow scientists and/or regulatory consultants to study the complex problem of calculating and predicting hourly ozone concentrations for a specific location, such as a city. The approach uses a variety of tools and techniques, including data gathering and modification, the use of a specific air quality model (the Ozone Isopleth Plotting Package, or OZIP), and guidelines for interpreting and repeating calcuations to make predictions and decisions. The key goal of EKMA is as follows:
The name itself is instructive of the underlying implementation of the approach:
The central focus of the EKMA is the graph generated as the product of the use of the OZIP modeling package. This graph is known as an isopleth, meaning "equal concentrations". The isopleth, shown below, is a graph with the concentrations of VOC emissions on the horizontal axis and the concentrations of the NOx emissions on the vertical axisusually in units of parts per million (ppm) or parts per billion (ppb). VOC units are typically notated as ppmC, parts per million of carbon. The curved lines on the graph represent the concentration of ozone at values specified by the model user. For example, the model user can ask that a curve be drawn at every value of VOC and NOx where the concentration of ozone is 0.12 ppm, which also happens to be the standard for air quality. Typically the user will ask the model to print a series of isopleths, such as 0.08, 0.12, 0.16, 0.20, etc. The user then can use these isopleths to make decisions about reducing one or both of the precursors to reach the desired maximum hourly concentration of ozone:

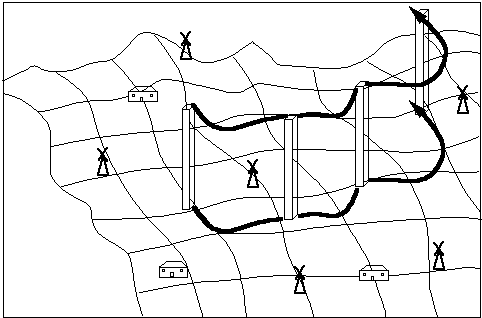
This modeling approach uses a Lagrangian modeling approach. In this approach (which differs from a fixed, or Eulerian model), the model considers a column of air which extends from the surface through a certain height above the surface. The column moves, and as a result, is subjected to fresh emissions, dilution, and chemical reactions. A graphic of a Lagrangian model is shown below:

EKMA can also be considered as a variant of a box model. In a box model, shown below, emissions enter the box and are transformed through a series of reactions (or a reaction mechanism). Transport in and out of the box is influenced by the surrounding meteorology. Dilution is usually taken into account:

 The Shodor
Education Foundation, Inc.