For example, suppose your starting ozone level is 0.158 ppm (parts per million). Your target is to reach an ozone level of 0.12 ppm. Your control strategy might be: let's try reducing NOx by 20% (-20%) and CO by 0%. Now run the model. The results table (described below) will tell you what your new ozone level will be at different percentages of VOCs reduction.
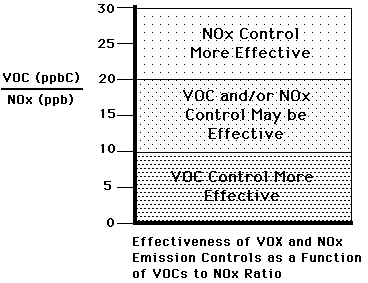
The basic interface also lets you vary the design ratio. The design ratio is a ratio of VOCs to NOx. This value is determined by collecting VOC and NOx data from monitoring stations in the field. Modelers must have their design ratios approved by the US Environmental Protection Agency (EPA) before they can be used in the model. The chart below helps you determine what you might try to control:

For example, if your design ratio is 8 to 1 (8 VOCs to 1 NOx), it would be smarter for you to try to reduce VOCs than to reduce NOx.
The basic interface lets you do very simple calculations in which you reduce NOx and/or CO by some percentages, then look at how different changes in VOCs affect the ozone level.

Now you have to put in the latitude and longitude of your location. If you click on either latitude or longitude, you can "look up" the latitude and longitude of your city. Simply type the numbers, such as "38.48". Do not include the "W" for west.
Now "dial in" the time zone. The interface is set for Eastern Standard Time (EST).
Now type in the year, month, and day of your simulation run. The Title and Initial Settings section is now complete!

The second value is the design ratio, the number that the EPA sets that we described before. Whatever number you put in, make sure it has a decimal point! (for example, "10.0", not "10").
Under Future Conditions, you type in how much you want to reduce NOx and/or CO by, in percentages. For example, if you want to reduce NOx by 20%, type in "-20.000". You can do the same for CO, or just leave it set at -0.00%.

If you do not wish an isopleth chart to be generated, make sure the box is unchecked. Your model will run faster if it does not have to generate the chart!
If you are going to use the isopleth chart, you should pick five (5) values that start below your target value and end a little bit above your starting value. For example, if your target is 0.10 ppm, and your starting value (daily design ratio) is 0.158, you might pick: 0.08, 0.10, 0.12, 0.14, and 0.16. If your target is 0.08 and your starting value is 0.18, you might pick 0.06, 0.10, 0.14, 0.18, and 0.22.

predicted changes in ozone for future changes in hc

  voc     nox     co      o3    %-chg voc  %-chg nox  %-chg co   %-chg o3

 1.196  0.108   1.700   .1561       0.0        0.0       0.0       -1.1
 1.076  0.108   1.700   .1531     -10.0        0.0       0.0       -3.0
 0.957  0.108   1.700   .1496     -20.0        0.0       0.0       -5.2
 0.837  0.108   1.700   .1459     -30.0        0.0       0.0       -7.6
 0.718  0.108   1.700   .1411     -40.0        0.0       0.0      -10.6
 0.598  0.108   1.700   .1355     -50.0        0.0       0.0      -14.2
 0.478  0.108   1.700   .1287     -60.0        0.0       0.0      -18.5
 0.359 0.108  1.700  .1200   -70.0       0.0      0.0     -24.0
 0.239  0.108   1.700   .1086     -80.0        0.0       0.0      -31.2
 0.120  0.108   1.700   .0929     -90.0        0.0       0.0      -41.2
 0.000  0.108   1.700   .0754    -100.0        0.0       0.0      -52.2