Information on temperature, pressures, and relative humidities can be found at several sources. The meteorologist can use these sources or other sources of his/her choosing:
| Temperature | Relative Humidities and Pressure | Ozone Monitoring Data |
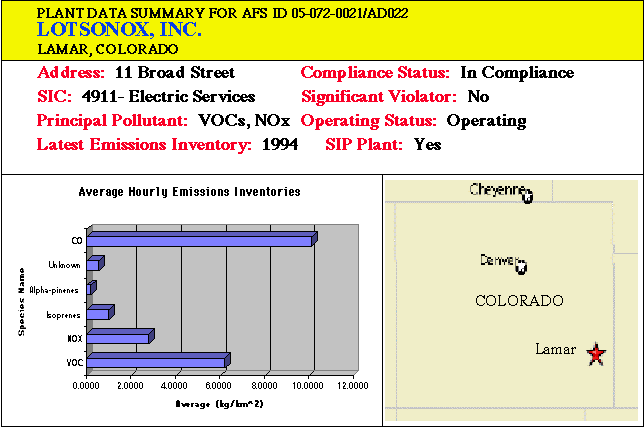
| Radiosonde Data Sources | Plant State Implementation Profile (SIP) |
One recommended procedure for determining hourly temperatures is to determine 30-year seasonal temperature averages (say from 1961-1991), and then use these values to determine reasonable hourly averages.
| Hour | Relative Humidity (%) |
| 800 | 55.0 |
| 900 | 54.0 |
| 1000 | 52.0 |
| 1100 | 48.0 |
| 1200 | 45.0 |
| 1300 | 43.0 |
| 1400 | 39.0 |
| 1500 | 35.0 |
| 1600 | 33.0 |
| 1700 | 32.0 |
| 1800 | 33.0 |
| 1900 | 35.0 |
| Pressure (mb) | 940 |
| Hour | Relative Humidity (%) | |
| 800 | 50.0 | |
| 900 | 47.0 | |
| 1000 | 43.0 | |
| 1100 | 41.0 | |
| 1200 | 37.0 | |
| 1300 | 35.0 | |
| 1400 | 32.0 | |
| 1500 | 30.0 | |
| 1600 | 28.0 | |
| 1700 | 29.0 | |
| 1800 | 31.0 | |
| 1900 | 33.0 | |
| Pressure (mb) | 940 |
| Hour | Relative Humidity (%) |
| 800 | 40.0 |
| 900 | 39.0 |
| 1000 | 38.0 |
| 1100 | 37.0 |
| 1200 | 35.0 |
| 1300 | 33.0 |
| 1400 | 31.0 |
| 1500 | 29.0 |
| 1600 | 27.0 |
| 1700 | 25.0 |
| 1800 | 27.0 |
| 1900 | 28.0 |
| Pressure (mb) | 940 |
| Hour | Relative Humidity (%) | |
| 800 | 48.0 | |
| 900 | 46.0 | |
| 1000 | 43.0 | |
| 1100 | 40.0 | |
| 1200 | 37.0 | |
| 1300 | 35.0 | |
| 1400 | 33.0 | |
| 1500 | 31.0 | |
| 1600 | 30.0 | |
| 1700 | 31.0 | |
| 1800 | 33.0 | |
| 1900 | 34.0 | |
| Pressure (mb) | 940 |
Urban Monitor Data
| Downwind Monitor Data
| Upwind Monitor Data
|
Choose "Upper Air Soundings", then either "Stuve" or "Skew-T" diagrams. Both give a plot of the sounding as well as a table summary of the sounding with wind, temperature, and height data at all the significant pressure levels.
Likely candidates for selection of cities are Denver (DNR), Dodge City Kansas (DDC), and Amarillo Texas (AMA). Radiosonde soundings are only taken twice a day, 0000 UTC and 1200 UTC.

 The Shodor
Education Foundation, Inc.