OZIP Sample Runs
View a sample output file.
The data below shows a run with a 20% reduction in NOx:
  predicted changes in ozone for future changes in hc

voc     nox     co      o3    %-chg voc  %-chg nox  %-chg co   %-chg o3

1.195  0.086   1.360   .1459       0.0      -20.0     -20.0       -7.6
1.076  0.086   1.360   .1441     -10.0      -20.0     -20.0       -8.7
0.956  0.086   1.360   .1416     -20.0      -20.0     -20.0      -10.3
0.837  0.086   1.360   .1388     -30.0      -20.0     -20.0      -12.1
0.717  0.086   1.360   .1351     -40.0      -20.0     -20.0      -14.4
0.598  0.086   1.360   .1310     -50.0      -20.0     -20.0      -17.0
0.478  0.086   1.360   .1260     -60.0      -20.0     -20.0      -20.2
0.359  0.086   1.360   .1201     -70.0      -20.0     -20.0      -24.0
0.239  0.086   1.360   .1126     -80.0      -20.0     -20.0      -28.7
0.120  0.086   1.360   .1032     -90.0      -20.0     -20.0      -34.7
0.000  0.086   1.360   .0901    -100.0      -20.0     -20.0      -43.0
The data below shows a run with no reduction in VOCs:
   predicted changes in ozone for future changes in nox

voc     nox     co      o3    %-chg voc  %-chg nox  %-chg co   %-chg o3

1.195  0.108   1.360   .1554       0.0        0.0     -20.0       -1.6
1.195  0.097   1.360   .1510       0.0      -10.0     -20.0       -4.4
1.195  0.086   1.360   .1459       0.0      -20.0     -20.0       -7.6
1.195  0.075   1.360   .1401       0.0      -30.0     -20.0      -11.2
1.195  0.065   1.360   .1335       0.0      -40.0     -20.0      -15.5
1.195  0.054   1.360   .1259       0.0      -50.0     -20.0      -20.3
1.195  0.043   1.360   .1169       0.0      -60.0     -20.0      -26.0
1.195  0.032   1.360   .1067       0.0      -70.0     -20.0      -32.4
1.195  0.022   1.360   .0947       0.0      -80.0     -20.0      -40.0
1.195  0.011   1.360   .0808       0.0      -90.0     -20.0      -48.9
1.195  0.000   1.360   .0650       0.0     -100.0     -20.0      -58.8
The data below shows a run with no reduction in VOCs, a 20% NOx reduction, and changes in CO concentration:
   predicted changes in ozone for future changes in co

voc     nox     co      o3    %-chg voc  %-chg nox  %-chg co   %-chg o3

1.195  0.086   1.700   .1463       0.0      -20.0       0.0       -7.3
1.195  0.086   1.530   .1461       0.0      -20.0     -10.0       -7.5
1.195  0.086   1.360   .1459       0.0      -20.0     -20.0       -7.6
1.195  0.086   1.190   .1456       0.0      -20.0     -30.0       -7.8
1.195  0.086   1.020   .1453       0.0      -20.0     -40.0       -8.0
1.195  0.086   0.850   .1451       0.0      -20.0     -50.0       -8.1
1.195  0.086   0.680   .1449       0.0      -20.0     -60.0       -8.2
1.195  0.086   0.510   .1446       0.0      -20.0     -70.0       -8.4
1.195  0.086   0.340   .1445       0.0      -20.0     -80.0       -8.5
1.195  0.086   0.170   .1441       0.0      -20.0     -90.0       -8.7
1.195  0.086   0.000   .1439       0.0      -20.0    -100.0       -8.8
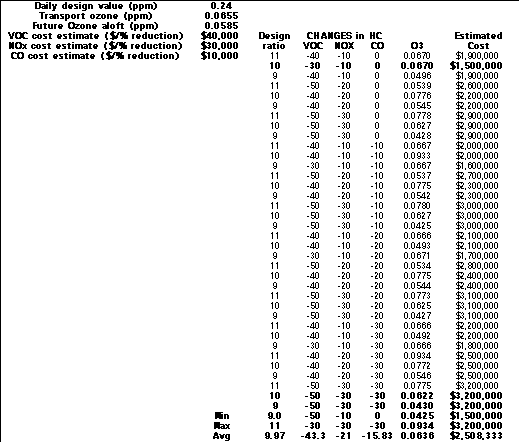
The data graphic below shows some initial test runs for reductions in VOCs, NOx, and CO, along with an arbitrary cost estimate based on the cost per percent reduction seen on the left.


Developed by
 The Shodor
Education Foundation, Inc.
Copyright © 1997

 The Shodor
Education Foundation, Inc.