NOTE: You may need to wait for several minutes to get the ouput HTML file. If if doesn't appear, revisit this page or use the RELOAD button.
Isopleth Graph
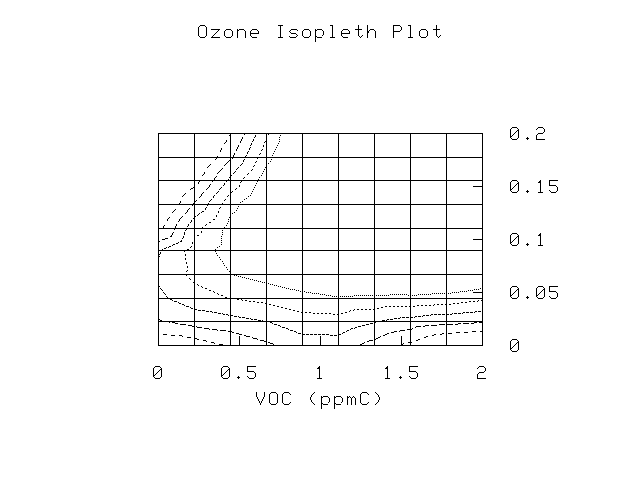
The graph of the isopleth is shown below. This is a plot of the intial concentrations of VOCs and NOx plotted against the concentration of ozone. An isopleth is a graph of "equal (iso) concentrations (pleth)".For an ozone value of 0.09 ppm, for example, the line shows every value of VOCs and NOx that combine to form that concentration (0.09 ppm) of ozone. One way to use this graph is to pick ONE value of VOC, such as 1.0 ppm, then move up and down the NOx axis and observe at what value(s) of NOx you intersect with the desired ozone concentration. For example, holding VOCs constant at 1.0 ppm, you might find that you intersect the 0.09 ppm O3 isopleth at two different concentrations of NOx. That means that when VOCs are 1.0 ppm and NOx are at either of those two NOx values, you will produce 0.09 ppm of ozone.
VOCs (in parts per million, or ppm) are plotted along the x-axis
NOx values are plotted on the y-axix in ppm. Concentrations plotted are 0.08, 0.09, 0.10, 0.11, and 0.12.
On the isopleth the lowest concentrations begin on the left side of the graph, and move from left to right. The concentration 0.08 is the first dotted line beginning at the left, followed by 0.09, 0.10, and so on.
 |